+44 (0)1983 534373 [email protected]
Kadalayil et al, Air purifiers improve rhinitis quality of life and perception of sleep quality in asthma patients
Table S1. Questions on sleep quality within the rhinitis quality of life questionnaire (RQLQ)
How troubled have you been by each of these sleep problems during the last week as a result of your nose/eye symptoms?
|
Questions |
Not troubled |
Hardly troubled |
Somewhat troubled |
Moderately troubled |
Quite a bit troubled |
Very troubled |
Extremely troubled |
|
1. Difficulty getting to sleep |
0 |
1 |
2 |
3 |
4 |
5 |
6 |
|
2. Wake up during night |
0 |
1 |
2 |
3 |
4 |
5 |
6 |
|
3. Lack of good night’s sleep |
0 |
1 |
2 |
3 |
4 |
5 |
6 |
Table S2. Air quality, rhinitis, aeroallergen sensitisation, asthma control, and asthma and rhinitis quality of life at baseline in the ITT population
|
|
Placebo (dummy filter) N=25 |
Intervention (active filter) N=25 |
P-value |
|
|
mean ± SDⴕ |
||
|
Particulate matter (PM2.5, μg/m3) [median (IQR)] § |
5.60 (2.99, 13.30) |
3.28 (0.49, 8.66) ¶ |
0.089 |
|
Rhinitis (Yes), n (%) |
76% (19/25) |
80% (20/25) |
0.733 |
|
Aeroallergen sensitisation (Yes) (n (%) ¥ |
84% (21/25) |
72% (18/25) |
0.306 |
|
Juniper Asthma control questionnaire-6 (ACQ6) scores |
2.26 ± 0.85 |
2.41 ± 0.67 |
0.483 |
|
Juniper asthma quality of life questionnaire (AQLQ) scores |
5.21 ± 0.91 |
5.58 ± 0.89 |
0.150 |
|
Juniper rhinitis quality of life questionnaire (RQLQ) scores |
42.16 ± 29.70 |
33.24 ± 32.01 |
0.312 |
ITT: intention-to-treat; SD: standard deviation; IQR: interquartile range; ⴕmean ± SD unless otherwise specified. §Medians (IQR) for highly skewed data; ¶N=23; ¥ Sensitisation to any of house dust mite, grass, tree pollen, Alternaria, Aspergillus, Penicillium, dander from pets or feather.
Table S3. Comparing the rhinitis quality of life questionnaire (RQLQ) of placebo and intervention groups using multivariable regression analysis.
|
Variables |
Coefficient (95% CI) ⴕ |
P-value |
|
BMI |
1.38 (0.01, 2.75) |
0.049 |
|
Household smokes (Y vs N) |
23.66 (1.70, 45.63) |
0.035 |
|
Groups (Intervention vs Placebo) § |
-16.64 (-32.04, -1.23) |
0.034 |
RQLQ scores of the intervention group (Dyson purifiers with active HEPA filters) was compared to that of the placebo group (with dummy filters) using multivariable repeated measures analyses (random intercept models). The analyses included a total of 550 data points collected from 25 participants from each of the groups who were followed up 11 times during the study to collect RQLQ data. Three subjects from the intervention group and two from the placebo group had missing score values for some visits resulting in 537 data points in the repeated measures analysis for the final model. The risk factors independently associated with RQLQ as identified in a stepwise backward elimination procedure starting from a fully adjusted model with 22 potential risk factors
Coefficient: regression coefficient; CI: confidence intervals; BMI: body mass index; RQLQ: Juniper rhinitis quality of life questionnaire
ⴕCoefficients presented are for the intervention group compared to the placebo group.
- Negative coefficient (reduction in RQLQ scores) indicates better rhinitis quality of life in Intervention.
Table S4. Linear regression analysis of sleep scores using longitudinal sleep data
|
Questions |
Nⴕ |
Coefficient (95% CI)§ |
P-value |
|
|
|
Placebo |
Intervention |
|
|
|
1. Difficulty getting to sleep |
25 |
25 |
-0.79 (-1.39, -0.20) |
0.009 |
|
2. Wake up during night |
25 |
25 |
-0.67 (-1.26, -0.08) |
0.026 |
|
3. Lack of good night’s sleep |
25 |
25 |
-0.63 (-1.31, 0.05) |
0.071 |
Repeated measures regression analysis of sleep data from 11 assessments based on three questions on sleep quality.
ⴕThere was a total of 538 (out of a possible 550) data points from 50 patients in the regression analyses.
- Coefficient represents the age-adjusted reduction in sleep scores in the intervention group compared to the placebo group
Table S5: Skin prick test results comparing aeroallergen sensitivity across the trial groups
|
Aeroallergens |
ITT population |
||
|
|
Placebo N = 25 |
Intervention N = 25 |
P-value* |
|
|
n (%) |
||
|
House dust mites (Yes) |
|||
|
Dermatophagoides pteronyssinus |
16 (64) |
18 (72) |
0.544 |
|
Dermatophagoides farinae |
16 (64) |
18 (72) |
0.544 |
|
Fungal allergens (Yes) |
|||
|
Alternaria |
0 |
2 (8) |
0.149 |
|
Aspergillus |
2 (8) |
2 (8) |
1 |
|
Cladosporium |
0 |
0 |
— |
|
Penicillium |
0 |
0 |
— |
|
Pollen (Yes) |
|||
|
Grass |
12 (48) |
12 (48) |
1 |
|
Tree |
3 (8) |
8 (32) |
0.088 |
|
Dander (Yes) |
|
|
|
|
Cat |
7 (28) |
9 (36) |
0.544 |
|
Dog |
4 (16) |
7 (28) |
0.306 |
|
Hamster |
0 |
0 |
— |
|
Feather |
0 |
0 |
— |
Skin prick tests were carried out for all trial participants at the baseline visit.
ITT: intention to treat; *chi-squared test
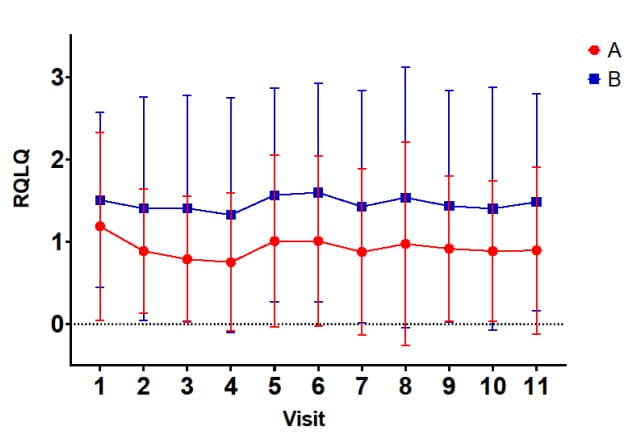
Figure S1. Mean RQLQ scores of the intervention (A) and placebo (B) groups across time. Each data point represents the mean RQLQ score at the indicated visit.